


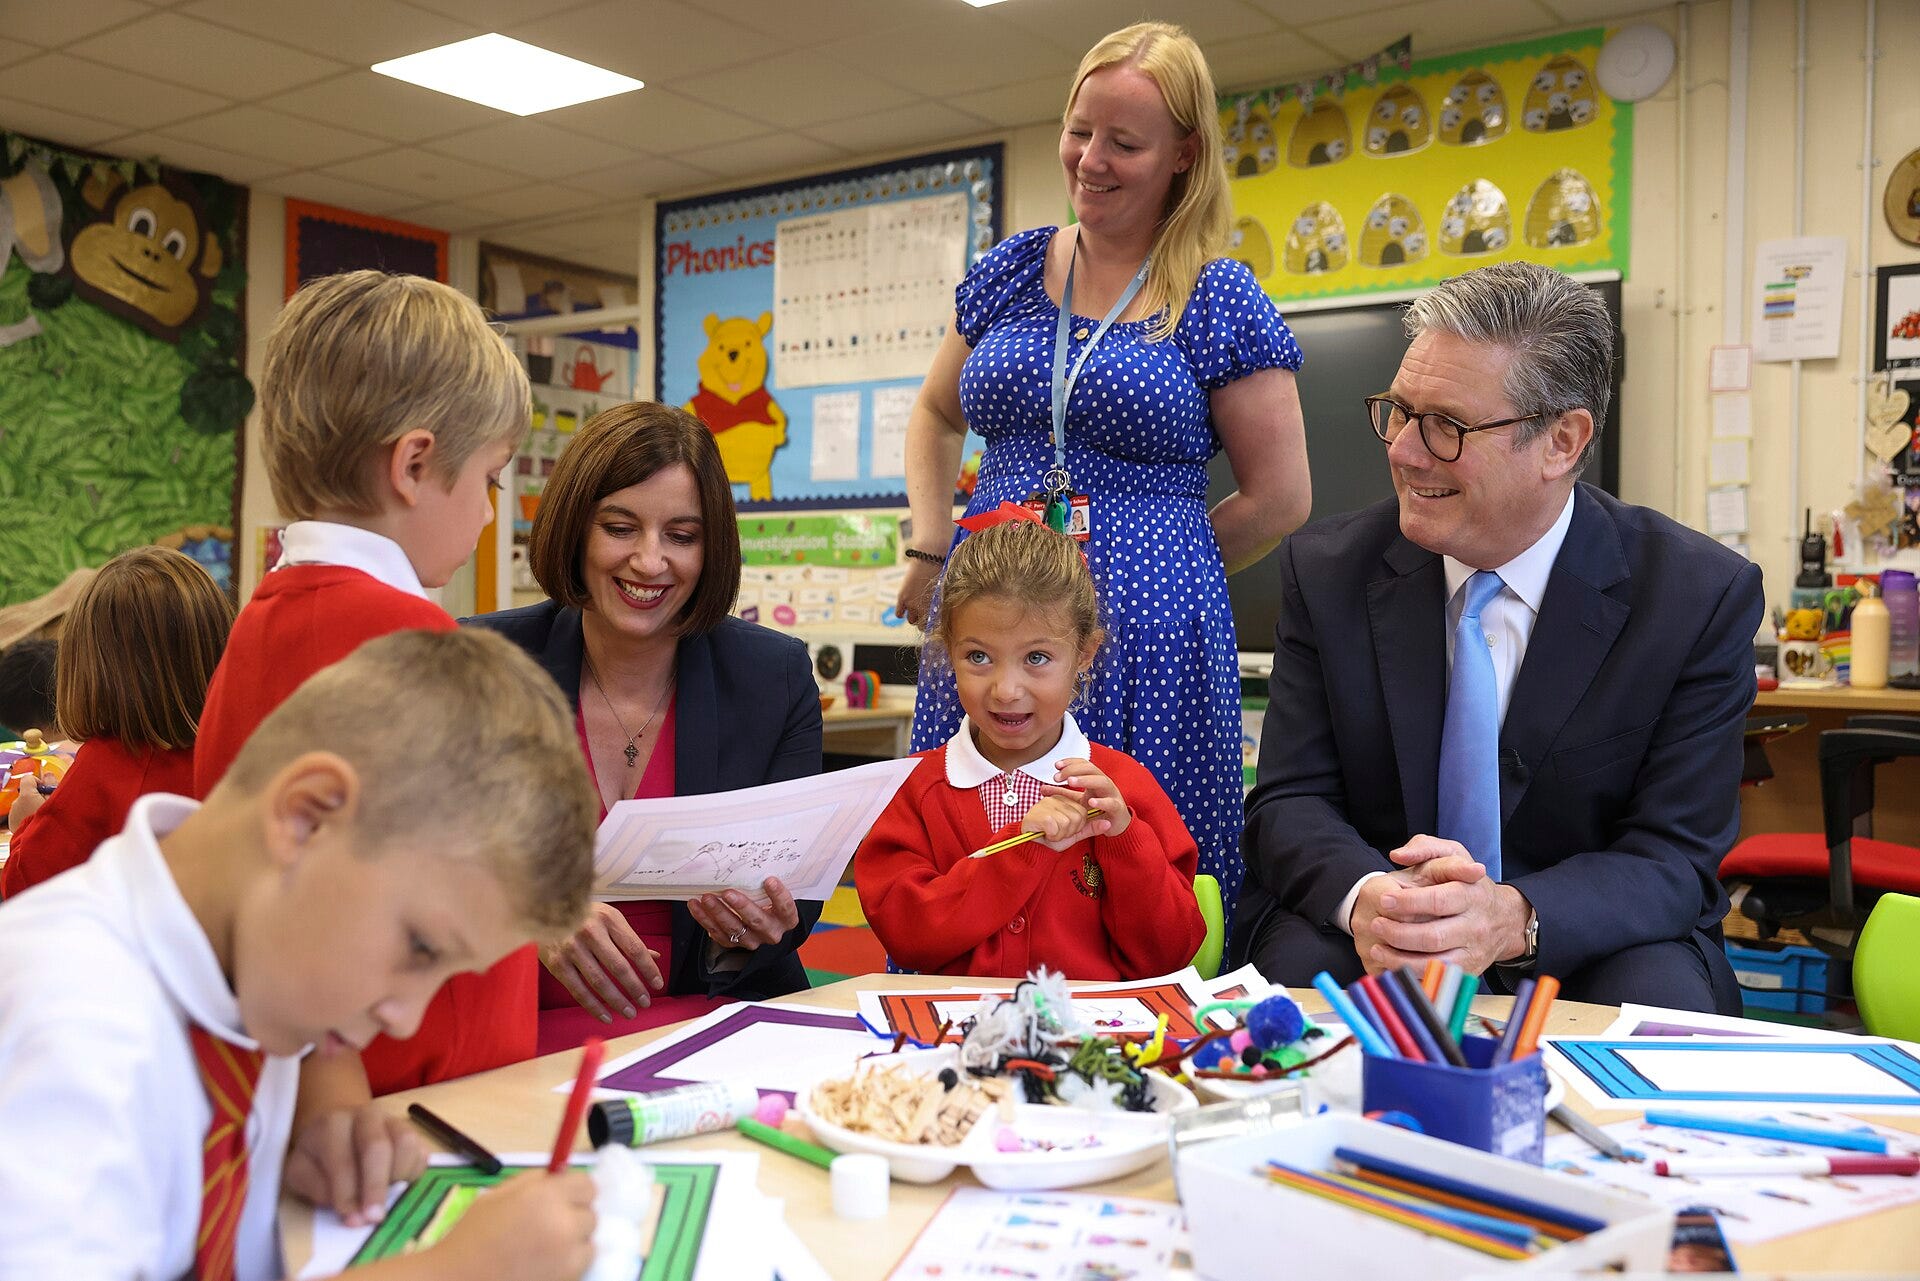
On Tuesday, after Prime Minister’s Questions, the Education Secretary Bridget Phillipson posted this.
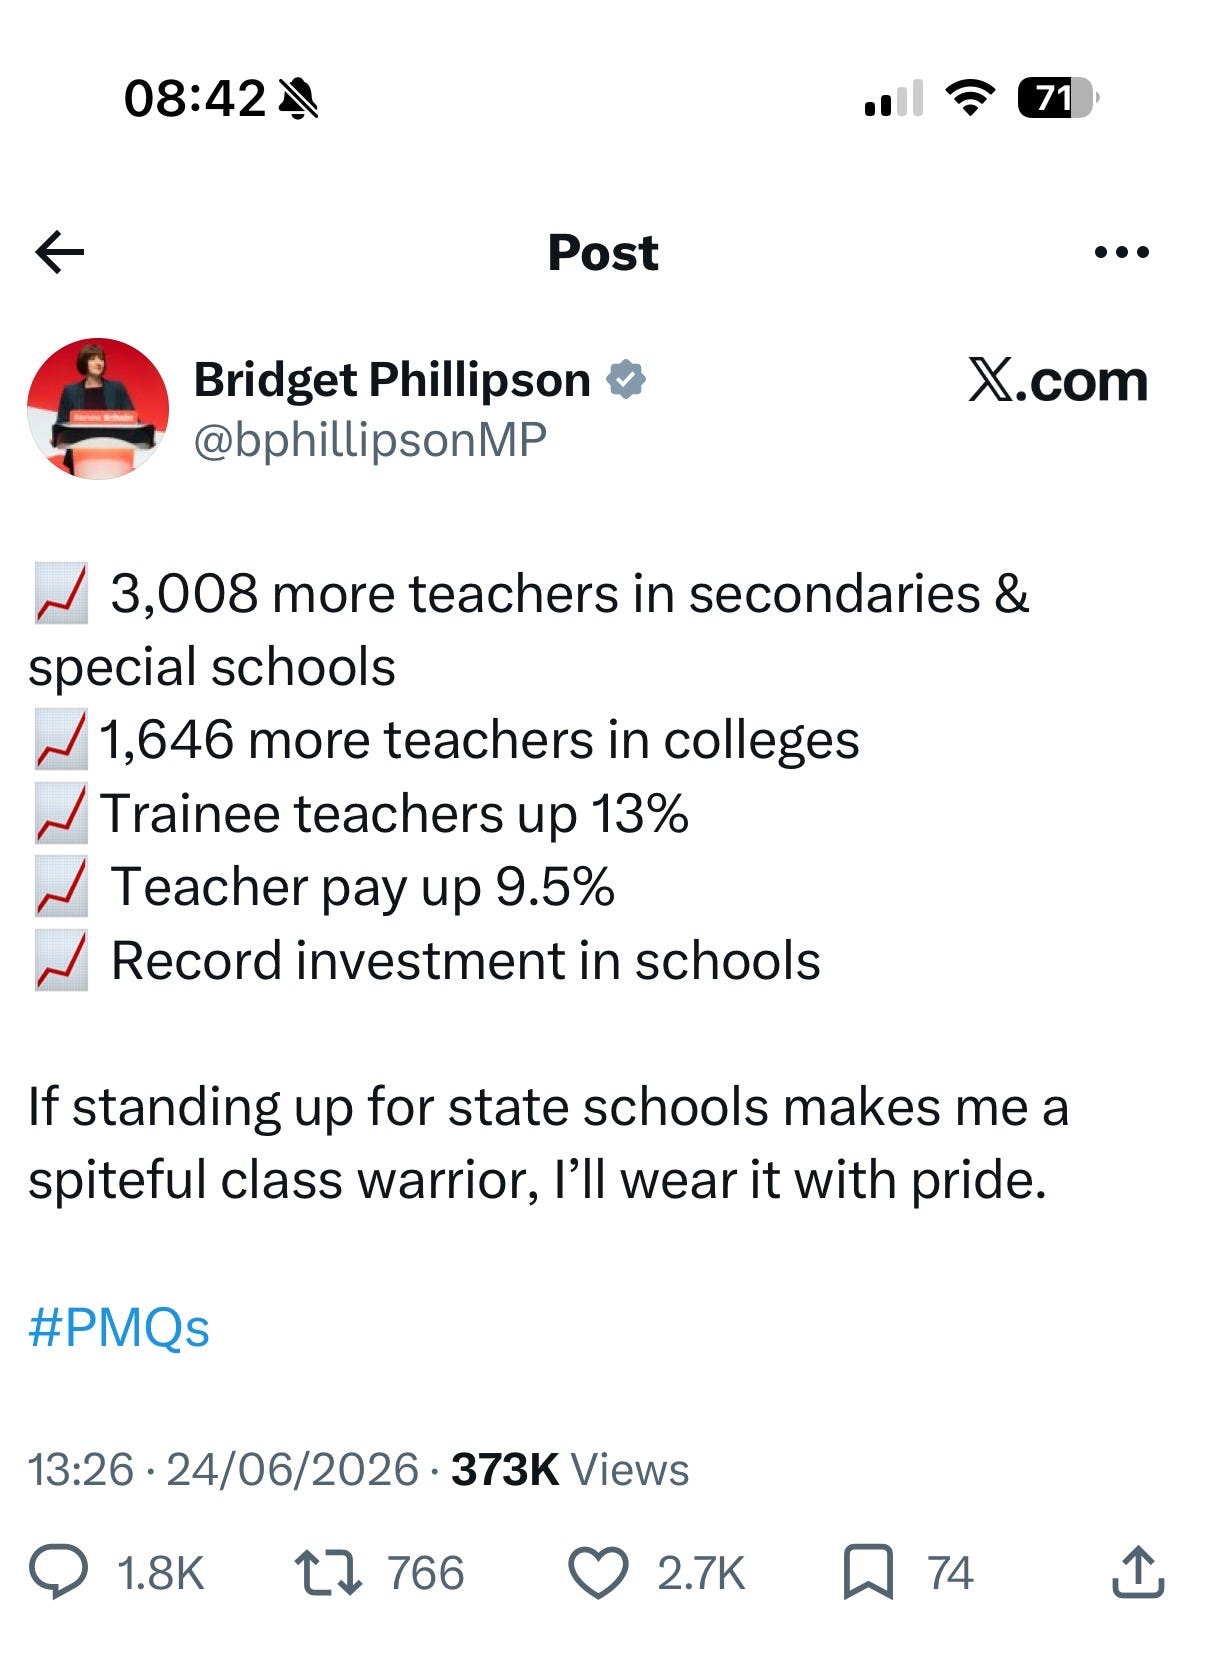
Every number in it is true and that’s exactly why it is worth a look.
A couple of weeks ago I wrote about how to read the internet without being played, and put the method into a little tool anyone can run. The point of it was never to catch people lying. Lying is the easy case. The hard case, the one that does most of the work in public life, is the true statement arranged to leave a false impression. This post is a clean specimen. So let me run it through.
Strip it
Underneath the arrows, the claim is simple: since Labour took office, the teaching workforce has grown. Five upward arrows in a row are there to make you feel that the whole system is moving in one direction.
It isn’t, and she knows it isn’t, because the figures she’s quoting come from the same Department for Education release that says so.
The number she left out
The 3,008 and the 1,646 are real. They are secondary, special schools and colleges. The figure that doesn’t appear anywhere in the post is the total. On the same day, the same release showed the overall number of teachers in England falling, by around 0.4 per cent. Primary teachers fell by 1.3 per cent, roughly 2,900 of them. The total school workforce shrank for the first time since 2019.
So the post lists the slices that went up and omits the whole that went down. Nothing in it is false, but the impression it is built to create is the opposite of what the data says.
This is the oldest move there is. Give a number without its denominator (step 3). “More teachers” means nothing until you ask: more than what, where, out of what total. The arrows answer none of those questions, and they are arranged so you won’t think to ask.
The timing
The DfE’s count folds in around 1,400 secondary and 900 special school teachers who turned up at the start of the 2024-25 academic year. That is September 2024. Two months after the election. Anyone who knows how schools hire knows those people were recruited the previous spring, under the previous government, before this one had done a thing. That is roughly 2,300 of the 3,008 that may have nothing to do with current policy. It’s a contested point rather than a proven one, but it’s a fair one, and the post is happy for you not to raise it.
The pay figure
“Teacher pay up 9.5%” is the two awards added together, 5.5 per cent last September and 4 per cent this one. True as a cash figure. Whether teachers are actually 9.5 per cent better off depends on inflation over the same stretch, which the arrow politely declines to mention.
The verdict
Here is what the check spits out, and what I’d want any reader to keep:
Confidence the individual numbers are accurate: high. They trace straight to the official release. Nobody is making things up.
Confidence the post is honest: low. Every figure is a true slice of a picture whose headline finding, the falling total, has been removed on purpose.
The honest version of this post exists, and it’s defensible. The 6,500 pledge really was always about secondary, special and further education, because that is where pupil numbers are rising while primary rolls fall with the birth rate. A government could stand up and say: we are moving teachers to where the children now are, and primary is shrinking because there are fewer small children, not because we failed. That argument would survive scrutiny.
She didn’t make it, because making it means saying the word “primary” and admitting the total fell.
The tell
The thing that turns this from spin into something worse is the last line. “If standing up for state schools makes me a spiteful class warrior, I’ll wear it with pride.”
Look at what that does, before anyone has checked a single figure, scrutiny has been recast as an attack on state schools and on poor kids. If you question the numbers, you’re not really questioning numbers, you’re sneering at the children.
It is a shield bolted on in advance, and its only function is to make sure the arrows are never examined.
That is the part with no scruples in it. Politicians have always chosen their best statistics, that’s politics, unfortunately.
You can pick your numbers, or you can claim the moral high ground. Pick one. You can’t do both. In an ideal world, she’d do neither and be honest about the choices that she and the government have made.
This was posted with pride. Someone fit for the job would be embarrassed to be caught arranging the numbers like this. The part that should worry everyone isn't her, it's that this is completely normal. A whole system of people who do this and genuinely believe it's the right way to behave.
Why this is worth your five minutes
None of this requires you to have a view on Labour, on Phillipson, or on teacher pay. The same checklist run on a Conservative post claiming the opposite would have to ask the same questions, and a fair one would catch the same tricks. A version of this from the other side, listing only the figures that fell, would be doing the identical thing in reverse.
It’s so easy to scroll past that and think ‘nice one Bridget’, and I’m not saying that your default position should always be out and out scepticism, but when someone is telling you something that you can see all around you is not reality, it needs to be checked.
More than what. Out of what total. Since when. Who hired them.
---
This is a live run of the method from The Internet Is Probably Lying to You
I used Claude Sonnet 4.6 (Low) initially, then I reran it against Opus 4.8 (High effort) - I wouldn’t normally as Sonnet works fine, but for publication I want to double, double check.
The tool is on GitHub if you want to point it at the next thing that scrolls past you.